


DSA-C03 Dumps 2026 - New Snowflake DSA-C03 Exam Questions
Free DSA-C03 Braindumps Download Updated on Jan 08, 2026 with 289 Questions
NEW QUESTION # 47
You are a data scientist working for a retail company using Snowflake. You're building a linear regression model to predict sales based on advertising spend across various channels (TV, Radio, Newspaper). After initial EDA, you suspect multicollinearity among the independent variables. Which of the following Snowflake SQL statements or techniques are MOST appropriate for identifying and addressing multicollinearity BEFORE fitting the model? Choose two.
- A. Calculate the Variance Inflation Factor (VIF) for each independent variable using a user-defined function (UDF) in Snowflake that implements the VIF calculation based on R-squared values from auxiliary regressions. This requires fitting a linear regression for each independent variable against all others.
- B. Use ' on each independent variable to estimate its uniqueness. If uniqueness is low, multicollinearity is likely.
- C. Generate a correlation matrix of the independent variables using 'CORR aggregate function in Snowflake SQL and examine the correlation coefficients. Values close to +1 or -1 suggest high multicollinearity.
- D. Implement Principal Component Analysis (PCA) using Snowpark Python to transform the independent variables into uncorrelated principal components and then select only the components explaining a certain percentage of the variance.
- E. Drop one of the independent variable randomly if they seem highly correlated.
Answer: A,C
Explanation:
Multicollinearity can be identified by calculating the VIF for each independent variable. VIF is calculated by regressing each independent variable against all other independent variables and calculating 1/(1-RA2), where RA2 is the R-squared value from the regression. A high VIF suggests high multicollinearity. Correlation matrices generated with 'CORR can also reveal multicollinearity by showing pairwise correlations between independent variables. PCA using Snowpark is also a viable option, but less direct than VIF and correlation matrix analysis for identifying multicollinearity. APPROX_COUNT_DISTINCT is not directly related to identifying multicollinearity. Randomly dropping variables will also lead to data loss.
NEW QUESTION # 48
You are tasked with building a model to predict customer churn. You have a table named in Snowflake with the following relevant columns: 'customer_id', 'login_date', , 'orders_placed', , and 'churned' (binary indicator). You want to engineer features that capture customer engagement over time using Snowpark for Python. Which of the following feature engineering steps, applied sequentially, are MOST effective in creating features indicative of churn risk?
- A. 1. Calculate the average 'page_views' per day for each customer. 2. Calculate the total number of for each customer. 3. Create a feature indicating whether the customer has a premium subscription ('subscription_type' = 'premium').
- B. 1. Calculate the maximum 'page_views' in a single day for each customer. 2. Calculate the total number of days with no 'login_date' for each customer. 3. Create a feature indicating if a customer has ever placed an order. 4. Use a simple boolean for the 'subscription_type' column.
- C. 1. Calculate the total 'page_views' and 'orders_placed' for each customer without considering time. 2. Use one-hot encoding for the 'subscription_type' column.
- D. 1. Calculate the average 'page_views' per week for each customer over the last 3 months using a window function. 2. Calculate the recency of the last order (days since last order) for each customer. 3. Create a feature indicating the change in average daily page views over the last month compared to the previous month. 4. Create a feature showing standard deviation of page_views per customer over the last 90 days.
- E. 1. Calculate the number of days since the customer's last login, and use nulls instead of negative numbers to indicate inactivity. 2. Calculate the rolling 7-day average of 'orders_placed' using a window function, partitioning by 'customer_id' and ordering by 'login_date'. 3. Calculate the slope of a linear regression of page_views' over time for each customer, indicating the trend in engagement using Snowpark ML. 4. Calculate the percentage of weeks the customer logged in. 5. Create a feature showing standard deviation of page_views per customer over the last 90 days.
Answer: D,E
Explanation:
Options B and E are the MOST effective because they incorporate time-based features and indicators of engagement trends. Recency (days since last order) captures the time elapsed since the customer's last interaction. Calculating changes in page views, the number of login days and linear regression slope identifies trends in engagement. Rolling averages smooth out daily fluctuations and capture longer-term patterns. Standard deviation of page views indicates a trend in page view variance, and thus overall customer engagement variance. Option A lacks recency and trend information. Option C misses temporal analysis. Option D has less relevance features and can be used however it is more useful to compare how well a customer is engaged with previous activity.
NEW QUESTION # 49
A pharmaceutical company is testing a new drug to lower blood pressure. They conduct a clinical trial with 200 patients. After treatment, the sample mean reduction in systolic blood pressure is 10 mmHg, with a sample standard deviation of 15 mmHg. You want to construct a 99% confidence interval for the true mean reduction in systolic blood pressure. Which of the following statements is most accurate concerning the appropriate distribution and critical value to use?
- A. Use a t-distribution with 199 degrees of freedom, and the critical value is slightly larger than 2.576.
- B. Use a chi-squared distribution with 199 degrees of freedom.
- C. Use a t-distribution with 200 degrees of freedom, and the critical value is close to 2.576.
- D. Use a z-distribution because the sample size is large (n > 30), and the critical value is approximately 2.576.
- E. Use a z-distribution because we are estimating mean, and use a critical value of 1.96.
Answer: A
Explanation:
The correct answer is B. While the sample size is considered 'large' (n > 30), it's more accurate to use a t-distribution when the population standard deviation is unknown and estimated by the sample standard deviation. The t-distribution accounts for the added uncertainty from estimating the standard deviation. The degrees of freedom are n-1 = 199. The critical value for a 99% confidence interval with a t-distribution and 199 degrees of freedom will be slightly larger than the z-score of 2.576. Option A is incorrect because using t-distribution is slightly better. Option C is incorrect because chi-squared distribution is for variance/standard deviation. Option D is incorrect since 1.96 is z score for 95%. Option E is incorrect as the degrees of freedom should be n-1.
NEW QUESTION # 50
You are building a data science pipeline in Snowflake to predict customer churn. The pipeline includes a Python UDF that uses a pre- trained scikit-learn model stored as a binary file in a Snowflake stage. The UDF needs to load this model for prediction. You've encountered an issue where the UDF intermittently fails, seemingly related to resource limits when multiple concurrent queries invoke the UDF. Which of the following strategies would best optimize the UDF for concurrency and resource efficiency, minimizing the risk of failure?
- A. Increase the memory allocated to the Snowflake warehouse to accommodate multiple UDF invocations.
- B. Utilize Snowflake's session-level caching by storing the loaded model in 'session.get('model')' to be reused across multiple UDF calls within the same session. Reload the model if 'session.get('model')' is None.
- C. Implement a global, lazy-loaded cache for the scikit-learn model within the UDF's module. The model is loaded only once during the first invocation and shared across subsequent calls. Protect the loading process with a lock to prevent race conditions in concurrent environments.
- D. Load the scikit-learn model inside the UDF function on every invocation to ensure the latest version is used.
- E. Load the scikit-learn model outside the UDF function in the global scope of the module so that all invocations share the same loaded model instance. Use the 'context.getExecutionContext(Y to track execution, making sure it is thread safe.
Answer: C
Explanation:
Option D provides the most efficient and robust solution. Loading the model only once (lazy loading) reduces overhead. A global cache ensures reusability. A lock is crucial to prevent race conditions during the initial loading in a concurrent environment. Option A is inefficient due to repeated loading. Option B is problematic because Snowflake UDFs do not directly support global variables in a thread-safe manner. Option C is incorrect as 'session.get' is not a valid Snowflake API for Python UDFs and lacks thread safety. Option E, while potentially helpful, doesn't address the underlying inefficiency of repeatedly loading the model.
NEW QUESTION # 51
You're developing a model to predict customer churn using Snowflake. Your dataset is large and continuously growing. You need to implement partitioning strategies to optimize model training and inference performance. You consider the following partitioning strategies: 1. Partitioning by 'customer segment (e.g., 'High-Value', 'Medium-Value', 'Low-Value'). 2. Partitioning by 'signup_date' (e.g., monthly partitions). 3. Partitioning by 'region' (e.g., 'North America', 'Europe', 'Asia'). Which of the following statements accurately describe the potential benefits and drawbacks of these partitioning strategies within a Snowflake environment, specifically in the context of model training and inference?
- A. Partitioning by 'region' is useful if churn is heavily influenced by geographic factors (e.g., local market conditions). It can improve query performance during both training and inference when filtering by region. However, it can create data silos, making it difficult to build a global churn model that considers interactions across regions. Furthermore, the 'region' column must have low cardinality.
- B. Using clustering in Snowflake on top of partitioning will always improve query performance significantly and reduce compute costs irrespective of query patterns.
- C. Implementing partitioning requires modifying existing data loading pipelines and may introduce additional overhead in data management. If the cost of partitioning outweighs the performance gains, it's better to rely on Snowflake's built-in micro-partitioning alone. Also, data skew in partition keys is a major concern.
- D. Partitioning by 'signup_date' is ideal for capturing temporal dependencies in churn behavior and allows for easy retraining of models with the latest data. It also naturally aligns with a walk-forward validation approach. However, it might not be effective if churn drivers are independent of signup date.
- E. Partitioning by 'customer_segment' is beneficial if churn patterns are significantly different across segments, allowing for training separate models for each segment. However, if any segment has very few churned customers, it may lead to overfitting or unreliable models for that segment.
Answer: A,C,D,E
Explanation:
Options A, B, C and E are correct because: A: Correctly identifies the benefits (segment-specific models) and drawbacks (overfitting on small segments) of partitioning by 'customer_segment. B: Accurately describes the advantages (temporal patterns, walk-forward validation) and limitations (independence from signup date) of partitioning by 'signup_date' . C: Properly explains the use case (geographic influence), performance benefits (filtering), and potential drawbacks (data silos) of partitioning by 'region'. E: Correctly highlights the implementation overhead and potential skew issues associated with partitioning. Option D is incorrect because Clustering on top of paritioning is not always guranteed performance improvements without assessing underlying query patterns. Snowflake automatically partitions data into micro-partitions, so additional clustering might not always result in significant performance improvements.
NEW QUESTION # 52
You are developing a machine learning model within a Snowflake UDF (User-Defined Function) written in Python. This UDF needs to access external Python libraries not included in the default Snowflake Anaconda channel. You've created a stage and uploaded the necessary file. You've successfully used 'conda create' and 'conda install --file requirements.txt' to create your environment locally, and subsequently zipped the environment. Now, what steps are essential to configure the Snowflake UDF to correctly use these external libraries from the stage? Select all that apply.
- A. Specify the stage path containing the zipped environment in the 'imports' clause of the 'CREATE OR REPLACE FUNCTION' statement using the symbol and specifying the zip file e.g., '@snowflake_packages/myenv.zip'.
- B. Install the packages directly into the Snowflake environment using 'CREATE OR REPLACE FUNCTION RETURNS VARCHAR ..: and a pip install command within the function.
- C. Create a ZIP file containing the Python environment and upload it to a Snowflake stage.
- D. Set the 'PYTHON_VERSION' parameter of the 'CREATE OR REPLACE FUNCTION' statement to match the Python version used in your environment using e.g. 'PYTHON_VERSION = '3.8".
- E. Include the line 'import sys; sys._xoptions['snowflake_home'] = at the top of your UDF to point to the environment stage location.
Answer: A,C,D
Explanation:
Options B, C, and D are crucial. Snowflake UDFs can use custom environments created and uploaded as ZIP files to a stage. The 'imports' clause in the function definition must point to the ZIP file on the stage (Option C). The 'PYTHON_VERSION' must match the environment's Python version (Option D). Option B describes the process of creating a deployment-ready ZIP file. Option A's approach of manually setting 'sys._xoptions' is incorrect and not a recommended or supported method. Option E is not the standard way to manage external libraries; uploading a pre-built environment is more reliable and avoids dependency conflicts during UDF execution.
NEW QUESTION # 53
You're deploying a pre-built image classification model hosted on a REST API endpoint, and you need to integrate it with Snowflake to classify images stored in cloud storage accessible via an external stage named 'IMAGE STAGE. The API expects image data as a base64 encoded string in the request body. Which SQL query snippet demonstrates the correct approach for calling the external function 'CLASSIFY IMAGE and incorporating the base64 encoding?
- A. Option B
- B. Option E
- C. Option A
- D. Option C
- E. Option D
Answer: D
Explanation:
Option C is correct. It uses 'SYSTEM$GET FILE(@IMAGE STAGE/image.jpg', to retrieve the image file as a binary object and then to encode it as a base64 string before passing it to the 'CLASSIFY_IMAGE external function. Option A is incorrect as it attempts to directly use a file format which is not relevant for sending the image content. Option B is incorrect because the image needs to be base64 encoded first. Option D is incorrect as it converts binary to JSON, which is not the required format. Option E is incorrect because BLOB TO BASE64' doesn't exists in Snowflake. TO BASE64 is correct method.
NEW QUESTION # 54
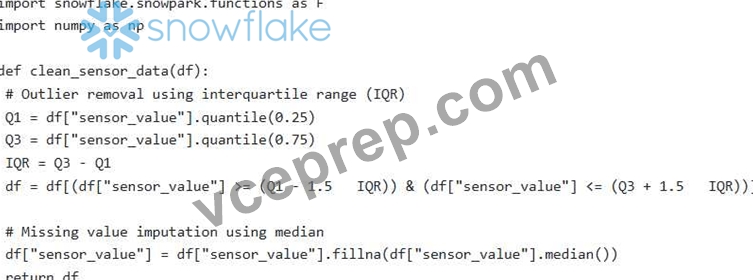
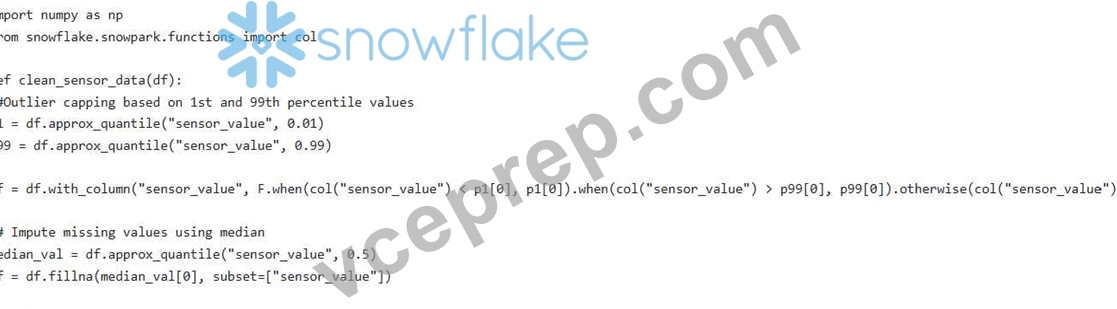
A data scientist is tasked with building a predictive maintenance model for industrial equipment. The data is collected from IoT sensors and stored in Snowflake. The raw sensor data is voluminous and contains noise, outliers, and missing values. Which of the following code snippets, executed within a Snowflake environment, demonstrates the MOST efficient and robust approach to cleaning and transforming this sensor data during the data collection phase, specifically addressing outlier removal and missing value imputation using robust statistics? Assume necessary libraries like numpy and pandas are available via Snowpark.
- A.

- B.
- C.

- D.

- E.
Answer: E
Explanation:
Option E is the MOST robust and efficient. It uses the interquartile range (IQR) method, which is less sensitive to extreme outliers than the z-score method in Option A. It also utilizes 'approx_quantile' and is therefore more optimized for Snowflake large datasets. The median is also a more robust measure of central tendency for imputation than the mean when dealing with outliers. Option C uses a hard-coded threshold for outlier removal and imputes with 0, which is not adaptive or robust. Option D skips data cleaning altogether.Option A uses z-score which may work however, since IoT has continuous streaming data quantile based outlier removal is better. It is more optimised for large dataset and better at handling streaming datasets.
NEW QUESTION # 55
You are working with a large dataset of sensor readings stored in a Snowflake table. You need to perform several complex feature engineering steps, including calculating rolling statistics (e.g., moving average) over a time window for each sensor. You want to use Snowpark Pandas for this task. However, the dataset is too large to fit into the memory of a single Snowpark Pandas worker. How can you efficiently perform the rolling statistics calculation without exceeding memory limits? Select all options that apply.
- A. Utilize the 'window' function in Snowpark SQL to define a window specification for each sensor and calculate the rolling statistics using SQL aggregate functions within Snowflake. Leverage Snowpark to consume the results of the SQL transformation.
- B. Explore using Snowpark's Pandas user-defined functions (UDFs) with vectorization to apply custom rolling statistics logic directly within Snowflake. UDFs allow you to use Pandas within Snowflake without needing to bring the entire dataset client-side.
- C. Break the Snowpark DataFrame into smaller chunks using 'sample' and 'unionAll', process each chunk with Snowpark Pandas, and then combine the results.
- D. Use the 'grouped' method in Snowpark DataFrame to group the data by sensor ID, then download each group as a Pandas DataFrame to the client and perform the rolling statistics calculation locally. Then upload back to Snowflake.
- E. Increase the memory allocation for the Snowpark Pandas worker nodes to accommodate the entire dataset.
Answer: A,B
Explanation:
Explanation:Options B and D are the most appropriate and efficient solutions for handling large datasets when calculating rolling statistics with Snowpark Pandas. Option B uses the 'window' function in Snowpark SQL. Leverage the 'window' function in Snowpark SQL to define a window specification for each sensor and calculate the rolling statistics using SQL aggregate functions within Snowflake. Option D uses Snowpark's Pandas UDFs. Snowpark's Pandas UDFs with vectorization allow you to bring the processing logic to the data within Snowflake, avoiding the need to move the entire dataset to the client-side and bypassing memory limitations. This approach is generally more scalable and performant for large datasets. Option A is inefficient as it retrieves groups of data from Snowflake to client side before creating the calculations before sending back to snowflake. Option C is correct but complex and not optimal. Option E is possible, but it's not a scalable solution and can be costly.
NEW QUESTION # 56
You have deployed a regression model in Snowflake as an external function using AWS Lambda'. The external function takes several numerical features as input and returns a predicted value. You want to continuously monitor the model's performance in production and automatically retrain it when the performance degrades below a predefined threshold. Which of the following methods represent VALID approaches for calculating and monitoring model performance within the Snowflake environment and triggering the retraining process?
- A. Build a Snowpark Python application deployed on Snowflake which periodically polls the external function's performance by querying the function with a sample data set and comparing results to ground truth stored in Snowflake. Initiate retraining directly from the Snowpark application if performance degrades.
- B. Implement custom logging within the AWS Lambda function to capture prediction results and actual values. Configure AWS CloudWatch to monitor these logs and trigger an AWS Step Function that initiates a new training job and updates the Snowflake external function with the new model endpoint upon completion.
- C. Create a Snowflake Task that periodically executes a SQL query to calculate performance metrics (e.g., RMSE) by comparing predicted values from the external function with actual values stored in a separate table. Trigger a Python UDF, deployed as a Snowflake stored procedure, to initiate retraining if the RMSE exceeds the threshold.
- D. Utilize Snowflake's Alerting feature, setting an alert rule based on the output of a SQL query that calculates performance metrics. Configure the alert action to invoke a webhook that triggers a retraining pipeline.
- E. Create a view that joins the input features with the predicted output and the actual result. Configure model monitoring within the AWS Sagemaker to perform continuous validation of the model.
Answer: B,C,D
Explanation:
Options A, B, and C all represent valid approaches. A uses Snowflake Tasks, SQL queries for metrics, and UDFs/stored procedures for retraining. B uses AWS Lambda logging, CloudWatch, and Step Functions to orchestrate retraining. C leverages Snowflake's Alerting feature and webhooks. D, while technically possible, is not scalable as polling an external function from Snowpark introduces unnecessary latency and overhead. E is partially correct; however Sagemaker can't directly validate data with the actual result in Snowflake. Therefore, we must use alerting or tasks within snowflake.
NEW QUESTION # 57
You are building a customer churn prediction model in Snowflake using Snowflake ML. After training, you need to evaluate the model's performance and identify areas for improvement. Given the following table 'PREDICTIONS' contains predicted probabilities and actual churn labels, which SQL query effectively calculates both precision and recall for the churn class (where 'CHURN = 1')?
- A. Option B
- B. Option C
- C. Option E
- D. Option A
- E. Option D
Answer: D
Explanation:
Option A correctly calculates precision and recall. Precision is calculated as True Positives / (True Positives + False Positives), and Recall is calculated as True Positives / (True Positives + False Negatives). The query in option A directly implements these formulas, where 'PREDICTED CHURN = 1 AND CHURN = 1' represents True Positives. Option B and E calculates accuracy. Option C calculates correlation. Option D calculates Precision and Recall for the negative class (non-churn).
NEW QUESTION # 58
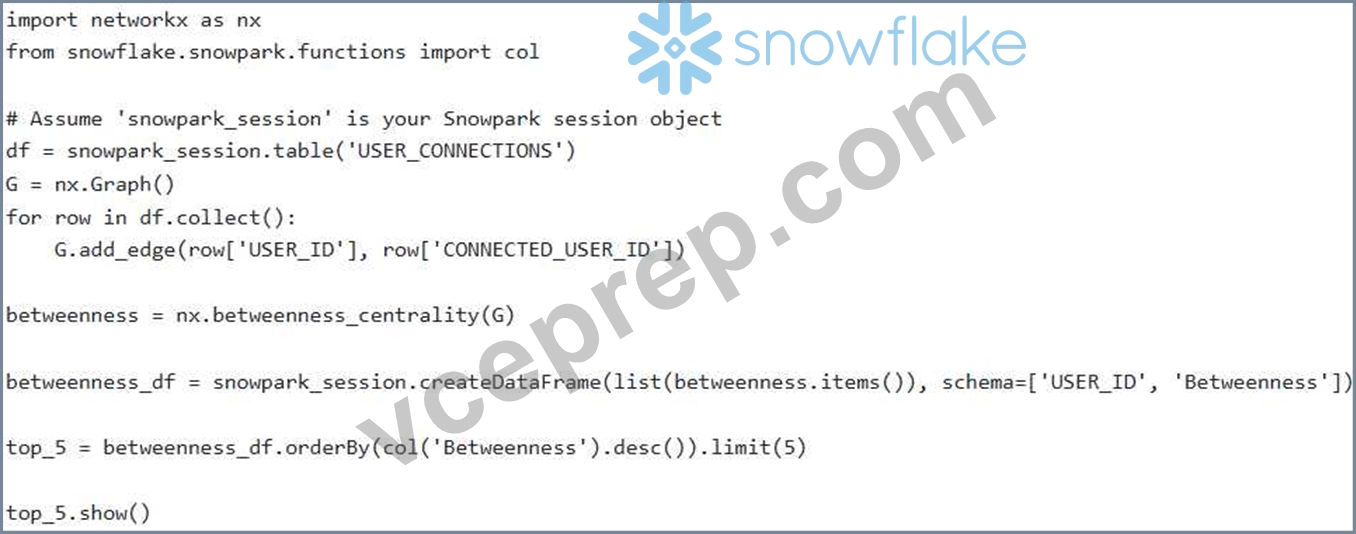
You are using the NetworkX library in Snowpark Python to analyze social network data stored in a Snowflake table named 'USER CONNECTIONS', which has columns 'USER ID' and 'CONNECTED USER representing connections between users. You want to find the users with the highest 'betweenness centrality' to identify influential nodes in the network. Which Snowpark Python code snippet would correctly calculate and display the top 5 users with the highest betweenness centrality?
- A.

- B.

- C.

- D.

- E.
Answer: D
Explanation:
Option A is the most efficient and correct approach. It leverages for directly creating the graph from a Pandas DataFrame (converted from the Snowpark DataFrame), calculates betweenness centrality using NetworkX, creates a Pandas DataFrame for results, and then sorts and displays the top 5 users. Options B iterates through the rows, which is less efficient, and attempts to create a Snowpark DataFrame from the betweenness dictionary, which isn't the most efficient output mechanism in this context. Option C is almost correct but uses 'nlargest' which is also valid. Option D uses which is slower and less efficient than Option E is very close but includes the parameter which is unnecessary for this specific operation since it's the initial creation of the betweenness df and the index isn't crucial to be reset. So while it functions it is redundant.
NEW QUESTION # 59
You are building a machine learning model to predict loan defaults. You have a dataset in Snowflake with the following features: 'income' (annual income in USD), 'loan_amount' (loan amount in USD), and 'credit_score' (FICO score). You need to normalize these features before training your model. The data has outliers in both 'income' and 'loan_amount', and 'credit_score' has a roughly normal distribution but you still want to standardize it to have a mean of 0 and standard deviation of 1. You want to perform these normalizations using only SQL in Snowflake (no UDFs). Which of the following SQL transformations are most suitable?
- A. Option B
- B. Option E
- C. Option A
- D. Option C
- E. Option D
Answer: D
Explanation:
Option C is the most suitable. Robust Scaling is appropriate for 'income' and 'loan_amount' due to the presence of outliers. Robust scaling, using IQR is less sensitive to extreme values than Min-Max or Z-score. Z-score standardization is suitable for 'credit_score' as it has a roughly normal distribution, and standardization is desired. Option A is incorrect since Min-Max scaling is highly sensitive to outliers. Option B is incorrect because Z-score is not outlier resilient and it doesn't take into account the data properties given for credit score. Log transformation and arcsinh transform can handle outliers, they're not as resilient as robust scaling. The arcsinh transformation is also useful for features that may have negative values, but we don't have that information here.
NEW QUESTION # 60
You have a dataset in Snowflake containing customer reviews. One of the columns, 'review_text', contains free-text customer feedback. You want to perform sentiment analysis on these reviews and include the sentiment score as a feature in your machine learning model. Furthermore, you wish to categorize the sentiment into 'Positive', 'Negative', and 'Neutral'. Given the need for scalability and efficiency within Snowflake, which methods could be employed?
- A. Use a Snowflake procedure that reads all 'review_text' data, transfers data outside of Snowflake to an external server running sentiment analysis software, and then writes results back into a new table.
- B. Use a Python UDF (User-Defined Function) with a pre-trained sentiment analysis library (e.g., NLTK or spaCy) to calculate the sentiment score and categorize it. Deploy the UDF in Snowflake and apply it to the 'review_text' column.
- C. Utilize Snowflake's external functions to call a pre-existing sentiment analysis API (e.g., Google Cloud Natural Language API or AWS Comprehend) passing the review text and storing the returned sentiment score and category. Ensure proper API key management and network configuration.
- D. Create a Snowpark Python DataFrame from the Snowflake table, use a sentiment analysis library within the Snowpark environment, categorize the sentiments, and then save the resulting DataFrame back to Snowflake as a new table.
- E. Create a series of Snowflake SQL queries utilizing complex string matching and keyword analysis to determine sentiment based on predefined lexicons. Categories are assigned through CASE statements.
Answer: B,C,D
Explanation:
Options A, B, and C are viable and efficient methods for sentiment analysis within Snowflake. A Python UDF leverages the compute power of Snowflake while utilizing popular Python NLP libraries. Snowpark offers a scalable way to process data within Snowflake using Python. Snowflake's External Functions provide access to pre-built sentiment analysis APIs, which can be highly accurate but may incur costs based on API usage. Option D is not appropriate as it transfers the data out of Snowflake to perform the sentiment analysis, which is a bad design. Option E can be used as well but sentiment scores based on SQL are not going to be as accurate as calling an API or leveraging an established library.
NEW QUESTION # 61
You're building a fraud detection model and want to determine if the average transaction amount for fraudulent transactions is significantly higher than the average transaction amount for legitimate transactions. You have two tables in Snowflake:
'FRAUDULENT TRANSACTIONS and 'LEGITIMATE TRANSACTIONS, both with a 'TRANSACTION AMOUNT column. You believe that FRAUDULENT TRANSACTIONS contains fewer than 30 transactions. You don't know the population standard deviations. What are the proper steps to conduct the hypothesis test, and what is the correct hypothesis statement?
- A. Perform a chi-squared test. Null Hypothesis: There is no relationship between transaction amount and whether a transaction is fraudulent. Alternative Hypothesis: There is a relationship between transaction amount and whether a transaction is fraudulent.
- B. Perform a t-test. Null Hypothesis: The average transaction amount for fraudulent transactions is less than or equal to the average transaction amount for legitimate transactions. Alternative Hypothesis: The average transaction amount for fraudulent transactions is greater than the average transaction amount for legitimate transactions.
- C. Perform a Z-test. Null Hypothesis: The average transaction amount for fraudulent transactions is less than or equal to the average transaction amount for legitimate transactions. Alternative Hypothesis: The average transaction amount for fraudulent transactions is greater than the average transaction amount for legitimate transactions.
- D. Perform a t-test. Null Hypothesis: The average transaction amount for fraudulent transactions is equal to the average transaction amount for legitimate transactions. Alternative Hypothesis: The average transaction amount for fraudulent transactions is not equal to the average transaction amount for legitimate transactions.
- E. Perform a Z-test. Null Hypothesis: The average transaction amount for fraudulent transactions is equal to the average transaction amount for legitimate transactions. Alternative Hypothesis: The average transaction amount for fraudulent transactions is not equal to the average transaction amount for legitimate transactions.
Answer: B
Explanation:
The correct answer is C. Since the sample size for fraudulent transactions is less than 30, and the population standard deviations are unknown, a t-test is more appropriate than a Z-test. The null hypothesis should state the assumption that we are trying to disprove (i.e., fraudulent transactions are not, on average, higher). The alternative hypothesis is the claim we are trying to support (i.e., fraudulent transactions ARE, on average, higher). The chi-squared test is used for categorical data, not continuous data like transaction amount. We are interested in knowing if one set of transaction amounts is greater, so its a one tailed t test.
NEW QUESTION # 62
You've built a regression model in Snowflake to predict customer churn. You've calculated the R-squared score on your test data and found it to be 0.65. However, after deploying the model to production and monitoring its performance over several weeks, you notice the model's predictive accuracy has significantly decreased. Which of the following factors could contribute to this performance degradation?
Select all that apply.
- A. Feature engineering inconsistencies: The feature engineering steps applied to the production data are different from those applied during training.
- B. Overfitting: The model learned the training data too well, capturing noise and specific patterns that do not generalize to new data.
- C. Increased data volume: The production data volume has increased significantly, causing resource contention and impacting model performance in Snowflake.
- D. Data drift: The distribution of the input features in the production data has changed significantly compared to the training data.
- E. Bias Variance trade off : Model is having high bias.
Answer: A,B,D
Explanation:
Options A, B, and C are all potential causes of performance degradation in a deployed regression model. Data drift (A) means the characteristics of the input data have changed, invalidating the model's assumptions. Overfitting (B) causes the model to perform poorly on unseen data. Feature engineering inconsistencies (C) introduce errors because the model expects features transformed in a specific way. Option D is less likely to be a direct cause of predictive degradation. Increased data volume might impact query performance or resource utilization but would not directly impact the model accuracy, if infrastructure has allocated adequetly. Option E would affect performance both during training and testing. Since R-squared is already low so model is already suffering from high bias
NEW QUESTION # 63
You're developing a model to predict equipment failure using sensor data stored in Snowflake. The dataset is highly imbalanced, with failure events (positive class) being rare compared to normal operation (negative class). To improve model performance, you're considering both up-sampling the minority class and down-sampling the majority class. Which of the following statements regarding the potential benefits and drawbacks of combining up-sampling and down-sampling techniques in this scenario are TRUE? (Select TWO)
- A. Down-sampling, when combined with up-sampling, can exacerbate the risk of losing important information from the majority class, leading to underfitting, especially if the majority class is already relatively small.
- B. The optimal sampling ratio for both up-sampling and down-sampling must always be 1:1, regardless of the initial class distribution.
- C. Using both up-sampling and down-sampling always guarantees improved model performance compared to using only one of these techniques, regardless of the dataset characteristics.
- D. Combining up-sampling and down-sampling can lead to a more balanced dataset, potentially improving the model's ability to learn patterns from both classes without introducing excessive bias from solely up-sampling.
- E. Over-sampling, combined with downsampling, makes the model more prone to overfitting since this causes the model to train on a large dataset.
Answer: A,D
Explanation:
Option A is correct: Combining both techniques can lead to a more balanced dataset, potentially improving the model's ability to learn patterns from both classes, if done correctly. Option C is correct: Down-sampling can exacerbate the risk of losing important information from the majority class, potentially leading to underfitting, especially if the majority class is already relatively small. Option B is incorrect because the effect depends on the data. Option D is incorrect because oversampling helps the model, even combined with downsampling, not to be prone to overfitting. Option E is incorrect because the right up/down-sampling ratio is very specific to the dataset.
NEW QUESTION # 64
You are tasked with training a logistic regression model in Snowflake using Snowpark Python to predict customer churn. Your data is stored in a table named 'CUSTOMER DATA' with columns like 'CUSTOMER D', 'FEATURE 1', 'FEATURE 2', 'FEATURE 3', and 'CHURN FLAG' (boolean representing churn). You plan to use stratified k-fold cross-validation to ensure each fold has a representative proportion of churned and non-churned customers. Which of the following code snippets demonstrates the correct way to perform stratified k-fold cross-validation with Snowpark ML? (Assume 'snowpark_session' is a valid Snowpark session object).
- A.

- B.

- C.

- D.

- E.

Answer: C
Explanation:
Option E is the only correct code snippet. Here's why: StratifiedKFold: It uses 'StratifiedKFold' from , which is necessary for ensuring that each fold has a similar class distribution. Pandas Conversion: The stratified k-fold split function requires Pandas dataframes as input, so tables 'CUSTOMER_DATA' is converted to Pandas DataFrame. Correct Data Preparation: The code splits features and labels correctly and passes them to StratifiedKFold'. The train and test indices derived from skf.split can be used to slice pandas dataframe and assign it to the correct variables. The ravel() converts the y into a ID array which is what is expected by the split method Snowflake ML Model Training: The 'LogisticRegression' model is fit and scored within the loop using the correct data. Other options are incorrect because: A: Uses KFold instead of StratifiedKFold, so does not stratify. Does not properly handle indices derived from the folds. B: Uses StratifiedKFold but does not properly handle indices derived from the folds, and doesn't use Pandas. C: Uses Pandas but doesn't pass proper input features, meaning split won't work. Also, handles indices improperly D: Improperly uses functions from Snowpark and doesn't use Pandas. Also, handles indices improperly.
NEW QUESTION # 65
......
Snowflake DSA-C03 Exam Practice Test Questions: https://actualtests.vceprep.com/DSA-C03-latest-vce-prep.html